Why Your Website is Slow (And Exactly How to Fix It): Page Speed & Core Web Vitals Guide 2026
All Quick Tool Team
May 7, 2026The Brutal Truth: A Slow Website is Invisible to Google
In 2021, Google officially made Core Web Vitals a ranking factor. In plain English: if your website loads slowly, Google ranks it lower, sends you less traffic, and your competitors with faster sites win your customers. This isn't theoretical. Studies show:
- A 1-second delay in page load time reduces conversions by 7%
- Pages that load in 1-2 seconds have a bounce rate 9x lower than pages loading in 5+ seconds
- Amazon calculated that every 100ms of latency costs them 1% in sales
- Google's own research shows 53% of mobile users abandon a page that takes longer than 3 seconds to load
- A site going from 8 seconds to 2 seconds load time can see a 74% increase in conversion rate
The good news: most website speed problems have straightforward solutions. This guide walks through the most common causes of slow websites and gives you actionable fixes—many requiring no technical expertise.
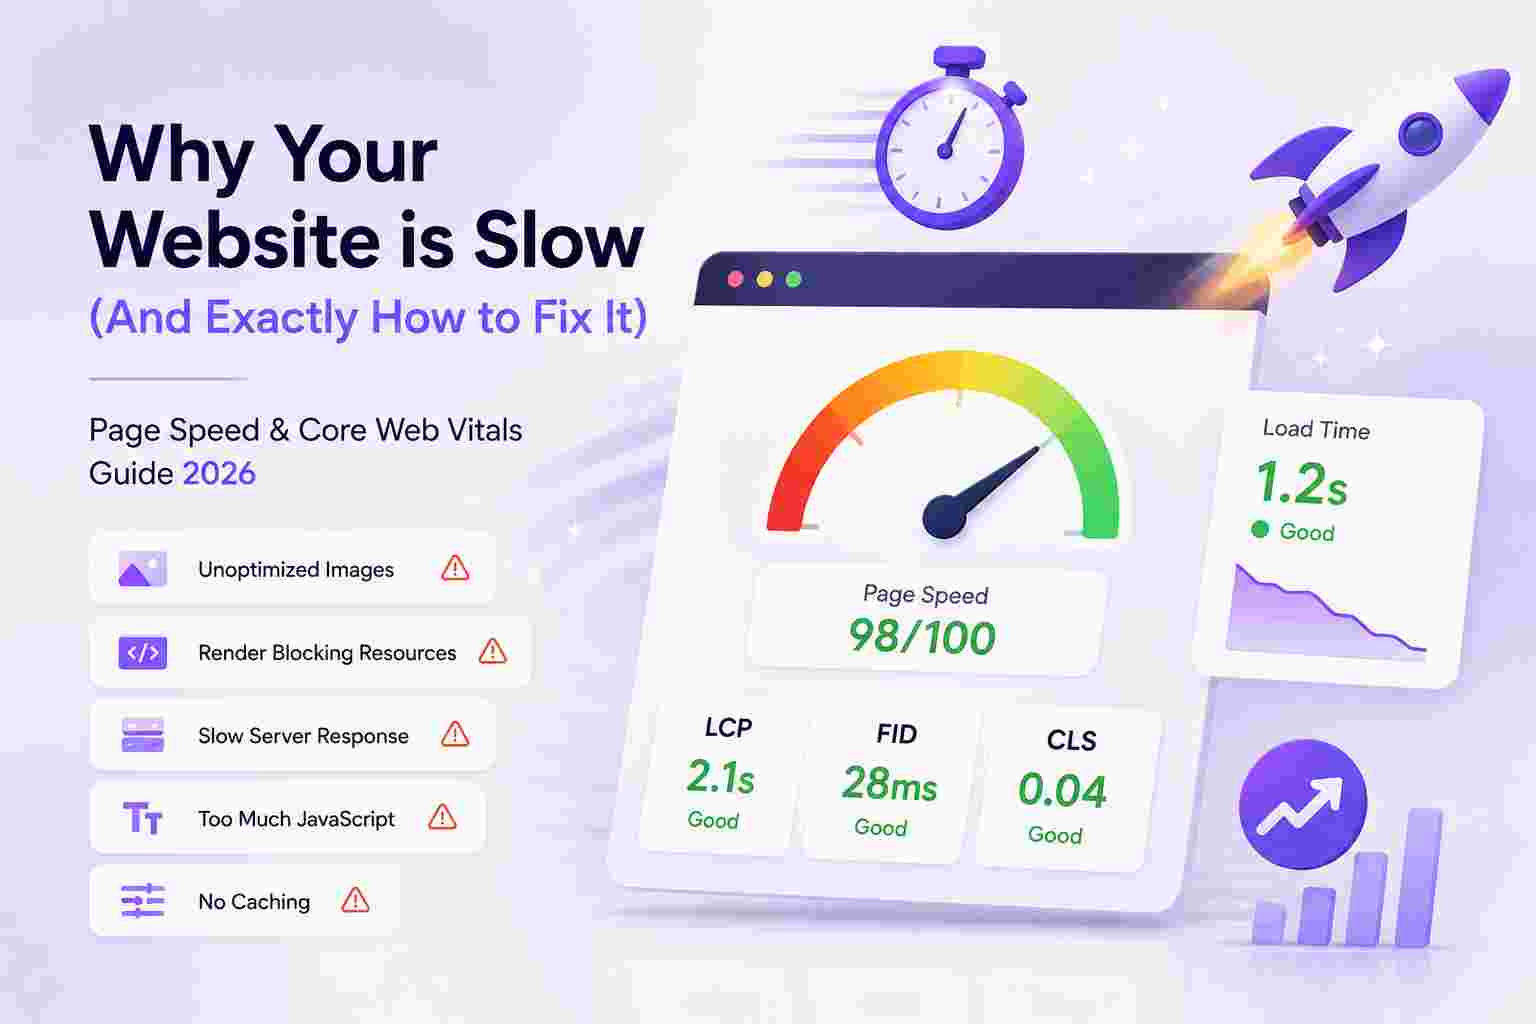
Understanding Core Web Vitals: What Google Actually Measures
LCP — Largest Contentful Paint
What it measures: How long it takes for the main content (usually a hero image or headline) to load and display.
- Good: under 2.5 seconds
- Needs Improvement: 2.5–4.0 seconds
- Poor: over 4.0 seconds
Most common cause of bad LCP: Unoptimized hero images. A 4MB JPG hero image on a landing page will almost always push LCP past 4 seconds on mobile.
Fix: Compress your hero image to under 200KB using our free image compressor. Switch to WebP format (25-35% smaller than JPG at equivalent quality). Preload the hero image in your HTML head tag.
FID / INP — First Input Delay / Interaction to Next Paint
What it measures: How quickly your page responds to the first user interaction (click, tap, key press). In 2024 Google replaced FID with INP (Interaction to Next Paint), which measures all interactions throughout the page session.
- Good INP: under 200 milliseconds
- Needs Improvement: 200–500 ms
- Poor: over 500 ms
Most common cause: Bloated JavaScript bundles, third-party scripts (chat widgets, analytics, ad networks) that block the main thread.
Fix: Defer non-critical JavaScript. Remove unused third-party scripts. Audit your plugins—one poorly coded plugin can add 500ms to INP.
CLS — Cumulative Layout Shift
What it measures: How much the page layout shifts unexpectedly as it loads (think: clicking a button and the page jumping just before you tap, making you click the wrong thing).
- Good: CLS score under 0.1
- Needs Improvement: 0.1–0.25
- Poor: over 0.25
Most common cause: Images without declared width/height attributes. The browser doesn't know how much space to reserve, so everything shifts when images load.
Fix: Always include width and height attributes on img tags. Resize images to final display dimensions before uploading using our image resizer.
The #1 Speed Killer: Unoptimized Images
Images are responsible for 50-70% of average page weight. On a typical blog or ecommerce site, this is the single most impactful thing you can fix. Here's what most website owners don't realize:
- A smartphone photo taken in 2025 is typically 4-8MB
- The same photo properly optimized for web is 100-400KB—a 90%+ reduction
- If you uploaded 20 product photos at 5MB each, your product page weighs 100MB
- That 100MB page takes 40+ seconds to load on a 4G connection—users left after 3 seconds
Image Optimization Checklist
- ✅ Compress every image before uploading (use our free compressor—runs locally, no upload needed)
- ✅ Resize to display dimensions — don't upload a 4000px wide image for a 600px column
- ✅ Use WebP format for all photos on modern websites (fallback JPG for older browsers)
- ✅ Use PNG only for logos and transparent elements — never for photos
- ✅ Enable lazy loading on below-the-fold images (loading="lazy" attribute)
- ✅ Use responsive images (srcset attribute) to serve smaller images to mobile devices
- ✅ Declare width and height on every img tag to prevent layout shift (CLS)
Quick Wins: Expected Speed Improvements from Image Optimization
- Compress hero image (5MB → 200KB): saves 3-5 seconds LCP on mobile
- Convert 20 product images to WebP: saves 2-4 seconds total page load
- Add lazy loading to 15 blog images: saves 60%+ initial bandwidth
- Combined: typical improvement from 8s → 2s load time (75% faster)
Typography & Font Loading Problems
Google Fonts and custom web fonts are another major performance trap. Every custom font requires a separate HTTP request. Loading 4 font weights (Regular, Bold, Italic, Bold Italic) for 2 font families = 8 network requests before any text displays.
Font Optimization Fixes
- Use font-display: swap in CSS — shows fallback font immediately while custom font loads (eliminates blank text flash)
- Self-host fonts instead of using Google Fonts CDN — reduces one external DNS lookup
- Preload critical fonts in HTML head — hint to browser to fetch fonts early
- Subset fonts — if you only use English, remove Latin Extended characters (saves 30-50% font file size)
- Limit font weights — use 2 weights maximum (Regular + Bold). Each additional weight adds 20-50KB
JavaScript & CSS Bloat
Modern websites load enormous amounts of JavaScript. The average website in 2025 loads 400KB+ of JavaScript—much of it unused on any given page. Every kilobyte of JavaScript is more expensive than an equivalent kilobyte of images because it must be parsed, compiled, and executed.
JavaScript Optimization Fixes
- Audit your plugins/widgets: A single live chat widget (e.g., Intercom, Drift) can add 300-500KB. If your chat-to-close rate is under 1%, it's hurting more than helping.
- Defer non-critical scripts: Add defer or async to script tags for analytics and non-critical libraries
- Remove unused JavaScript: Chrome DevTools Coverage panel shows exactly which lines of code are never executed
- Code splitting: If you use React/Vue/Next.js, ensure code splitting is configured to only load JS needed for the current page
Hosting & Server Response Time (TTFB)
Time to First Byte (TTFB) is how long the server takes to send the first byte of response. If your TTFB is over 600ms, your hosting is a bottleneck regardless of how optimized your images are.
Diagnosis
- Test TTFB at web.dev/measure or Google PageSpeed Insights
- Good TTFB: under 200ms
- Poor TTFB: over 600ms (likely a hosting problem)
Server Optimization Fixes
- Enable caching: Static pages should be served from cache, not regenerated for every visitor
- Use a CDN: Content Delivery Networks serve your site from servers close to each visitor's location. Cloudflare free tier often reduces TTFB by 200-400ms for international visitors.
- Upgrade hosting: Shared hosting can bottleneck at 600ms+ TTFB. VPS hosting typically achieves 100-200ms.
- Enable HTTP/2: Allows multiple requests over a single connection, reducing overhead significantly
Tools to Measure Your Website Speed (All Free)
- Google PageSpeed Insights (pagespeed.web.dev) — Official Core Web Vitals score + actionable recommendations
- GTmetrix — Waterfall chart showing which resources take longest to load
- WebPageTest — Advanced testing from multiple global locations and real devices
- Chrome DevTools Lighthouse — Run from your browser, detailed audit with code-level recommendations
Step-by-Step Website Speed Improvement Plan
- Baseline: Run PageSpeed Insights. Screenshot your current LCP, INP, CLS scores.
- Image audit: Download and check file sizes of all images. Compress any over 200KB using our image compression tool.
- Image resize: Confirm images are displayed at correct dimensions. Resize oversized images with our image resizer.
- Format conversion: Convert JPG images to WebP for 25-35% additional savings.
- Font audit: Reduce to 2 font weights. Add font-display: swap.
- Script audit: Remove or defer plugins not used on every page.
- Caching: Enable browser caching for static assets (images, CSS, JS).
- Retest: Run PageSpeed Insights again. Compare improvement.
Expected outcome: Most websites following this plan move from a PageSpeed score of 40-60 to 80-95+, achieving significant improvements in all three Core Web Vitals within a few hours of work.
Conclusion
Website speed is no longer optional for anyone competing for Google traffic. The steps in this guide—starting with image optimization—are the highest-leverage actions you can take right now. No developer required, no expensive tools needed. Start with your images using our free image tools, measure your improvement with PageSpeed Insights, and repeat for other resources.
Also read our guides on complete image optimization and content optimization tools for a complete performance and productivity workflow.
Discover More Tools & Guides
Explore all of All Quick Tool's resources and tutorials to boost your productivity.
Complete Guide to Image Optimization: Compress, Resize & Convert for Web Performance
Master professional image optimization techniques. Learn how to compress images, resize for different platforms, and convert formats while maintaining quality. Improve website speed, SEO rankings, and user experience with free tools.
Maximize Productivity with Text Tools: 5 Essential Tips for Content Creators, Students & Writers
Master 5 essential text tools to streamline your workflow. Learn word counting, text formatting, duplicate removal, and content optimization techniques for students, bloggers, and professionals.
QR Codes Explained: How to Create & Use Professional QR Codes for Marketing & Business
Complete guide to creating and using QR codes. Learn QR code types, best practices, marketing applications, design tips, and how to generate professional codes for business cards, social media, packaging, and events.